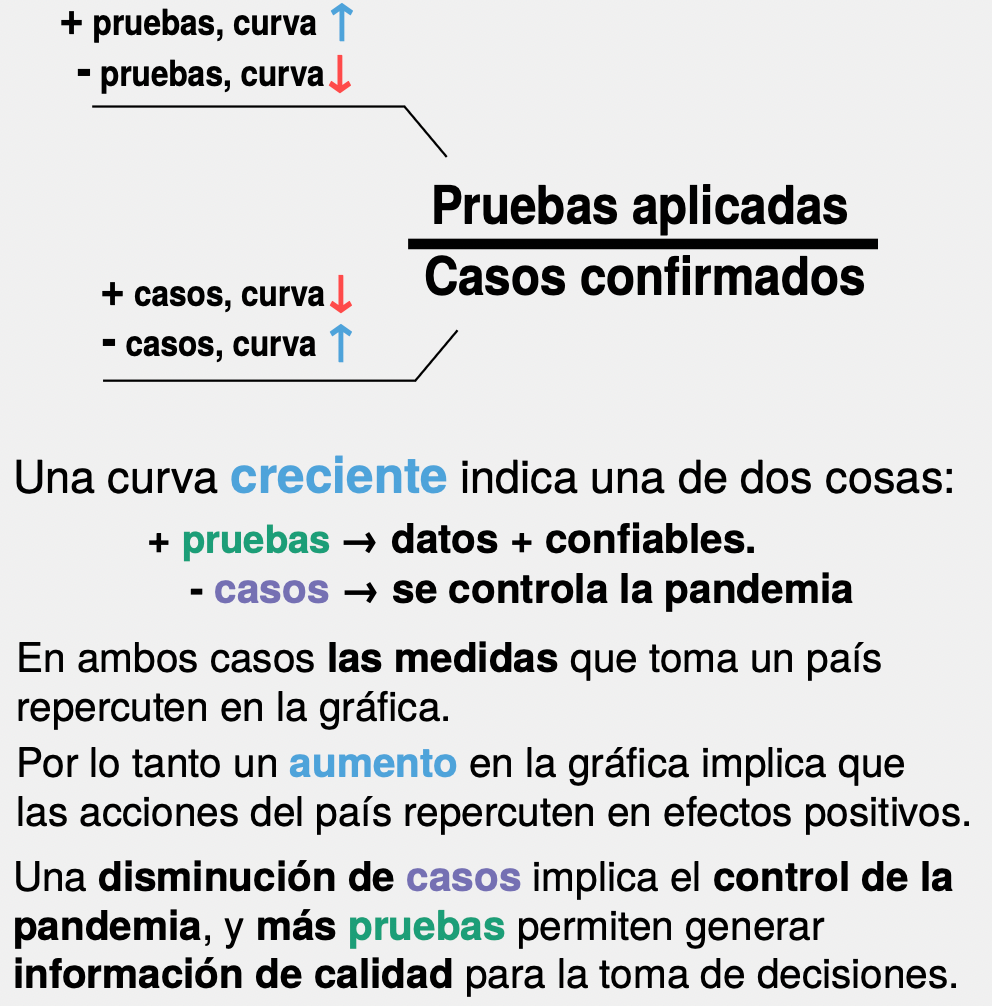
(In Spanish) Explanation of the movements in the curve.
When the curve grows, it is either due to more tests being performed (indicating more reliable data) or less cases detected (indicating that less people are being infected).
On the other hand, when the curve decreases, it means that the country will have a harder time dealing with the pandemic, either due to having less information to analyze, or because cases are rising.
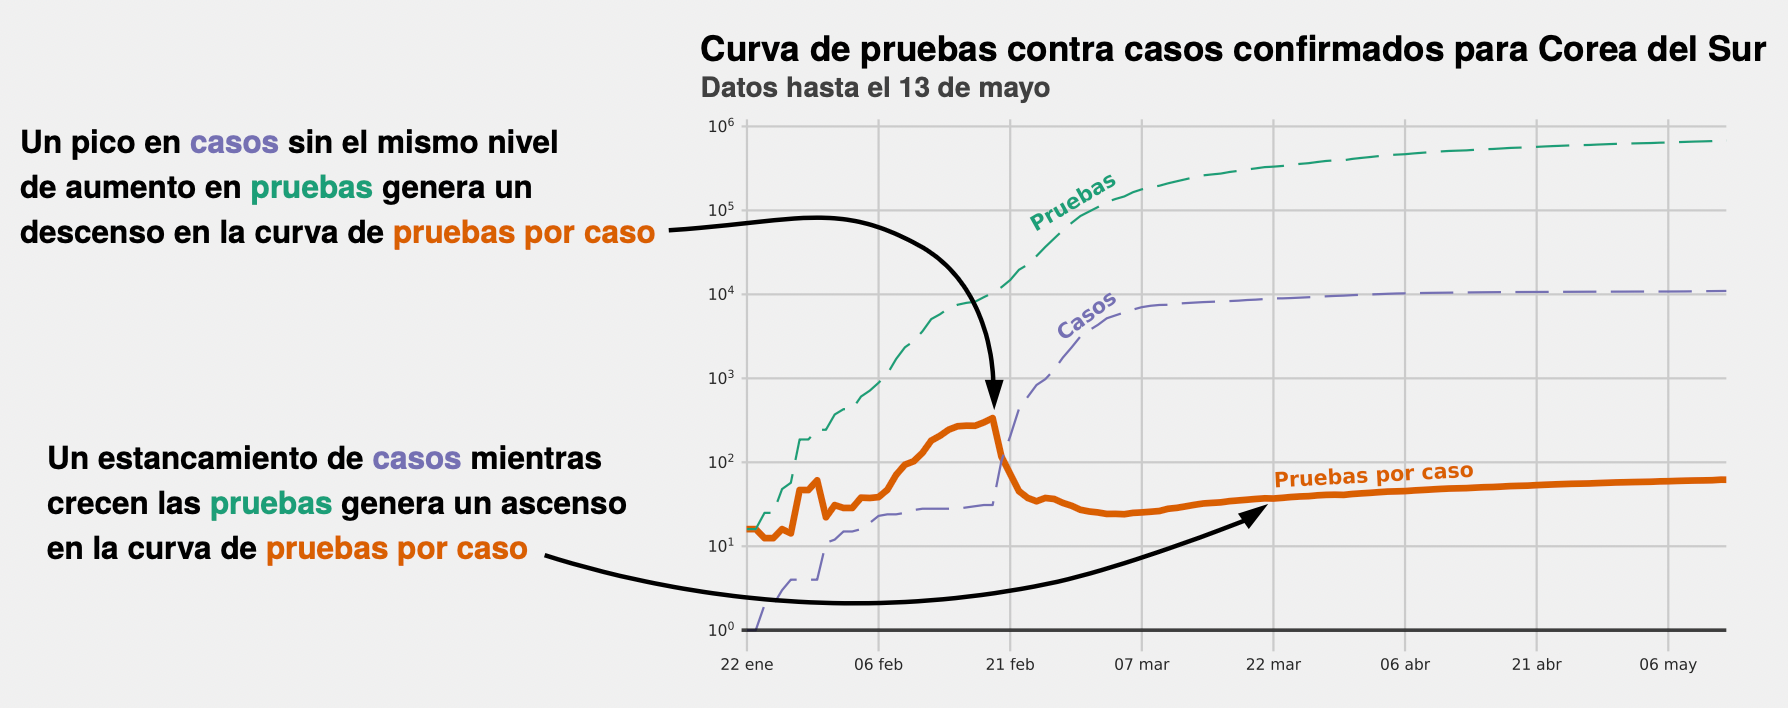
(In Spanish) Example for South Korea's curve.
The leftmost arrow shows that a peak in cases without an equal increase in testing will cause the curve to decrease, therefore indicating that the state of the pandemic (in these early stages) is worse for the country due to cases increasing faster than tests do.
The rightmost arrow shows that when cases remain mostly constant and tests raise faster than positive COVID-19 cases, the curve will rise steadily. This shows a relative improvement in the country's outlook for the pandemic.
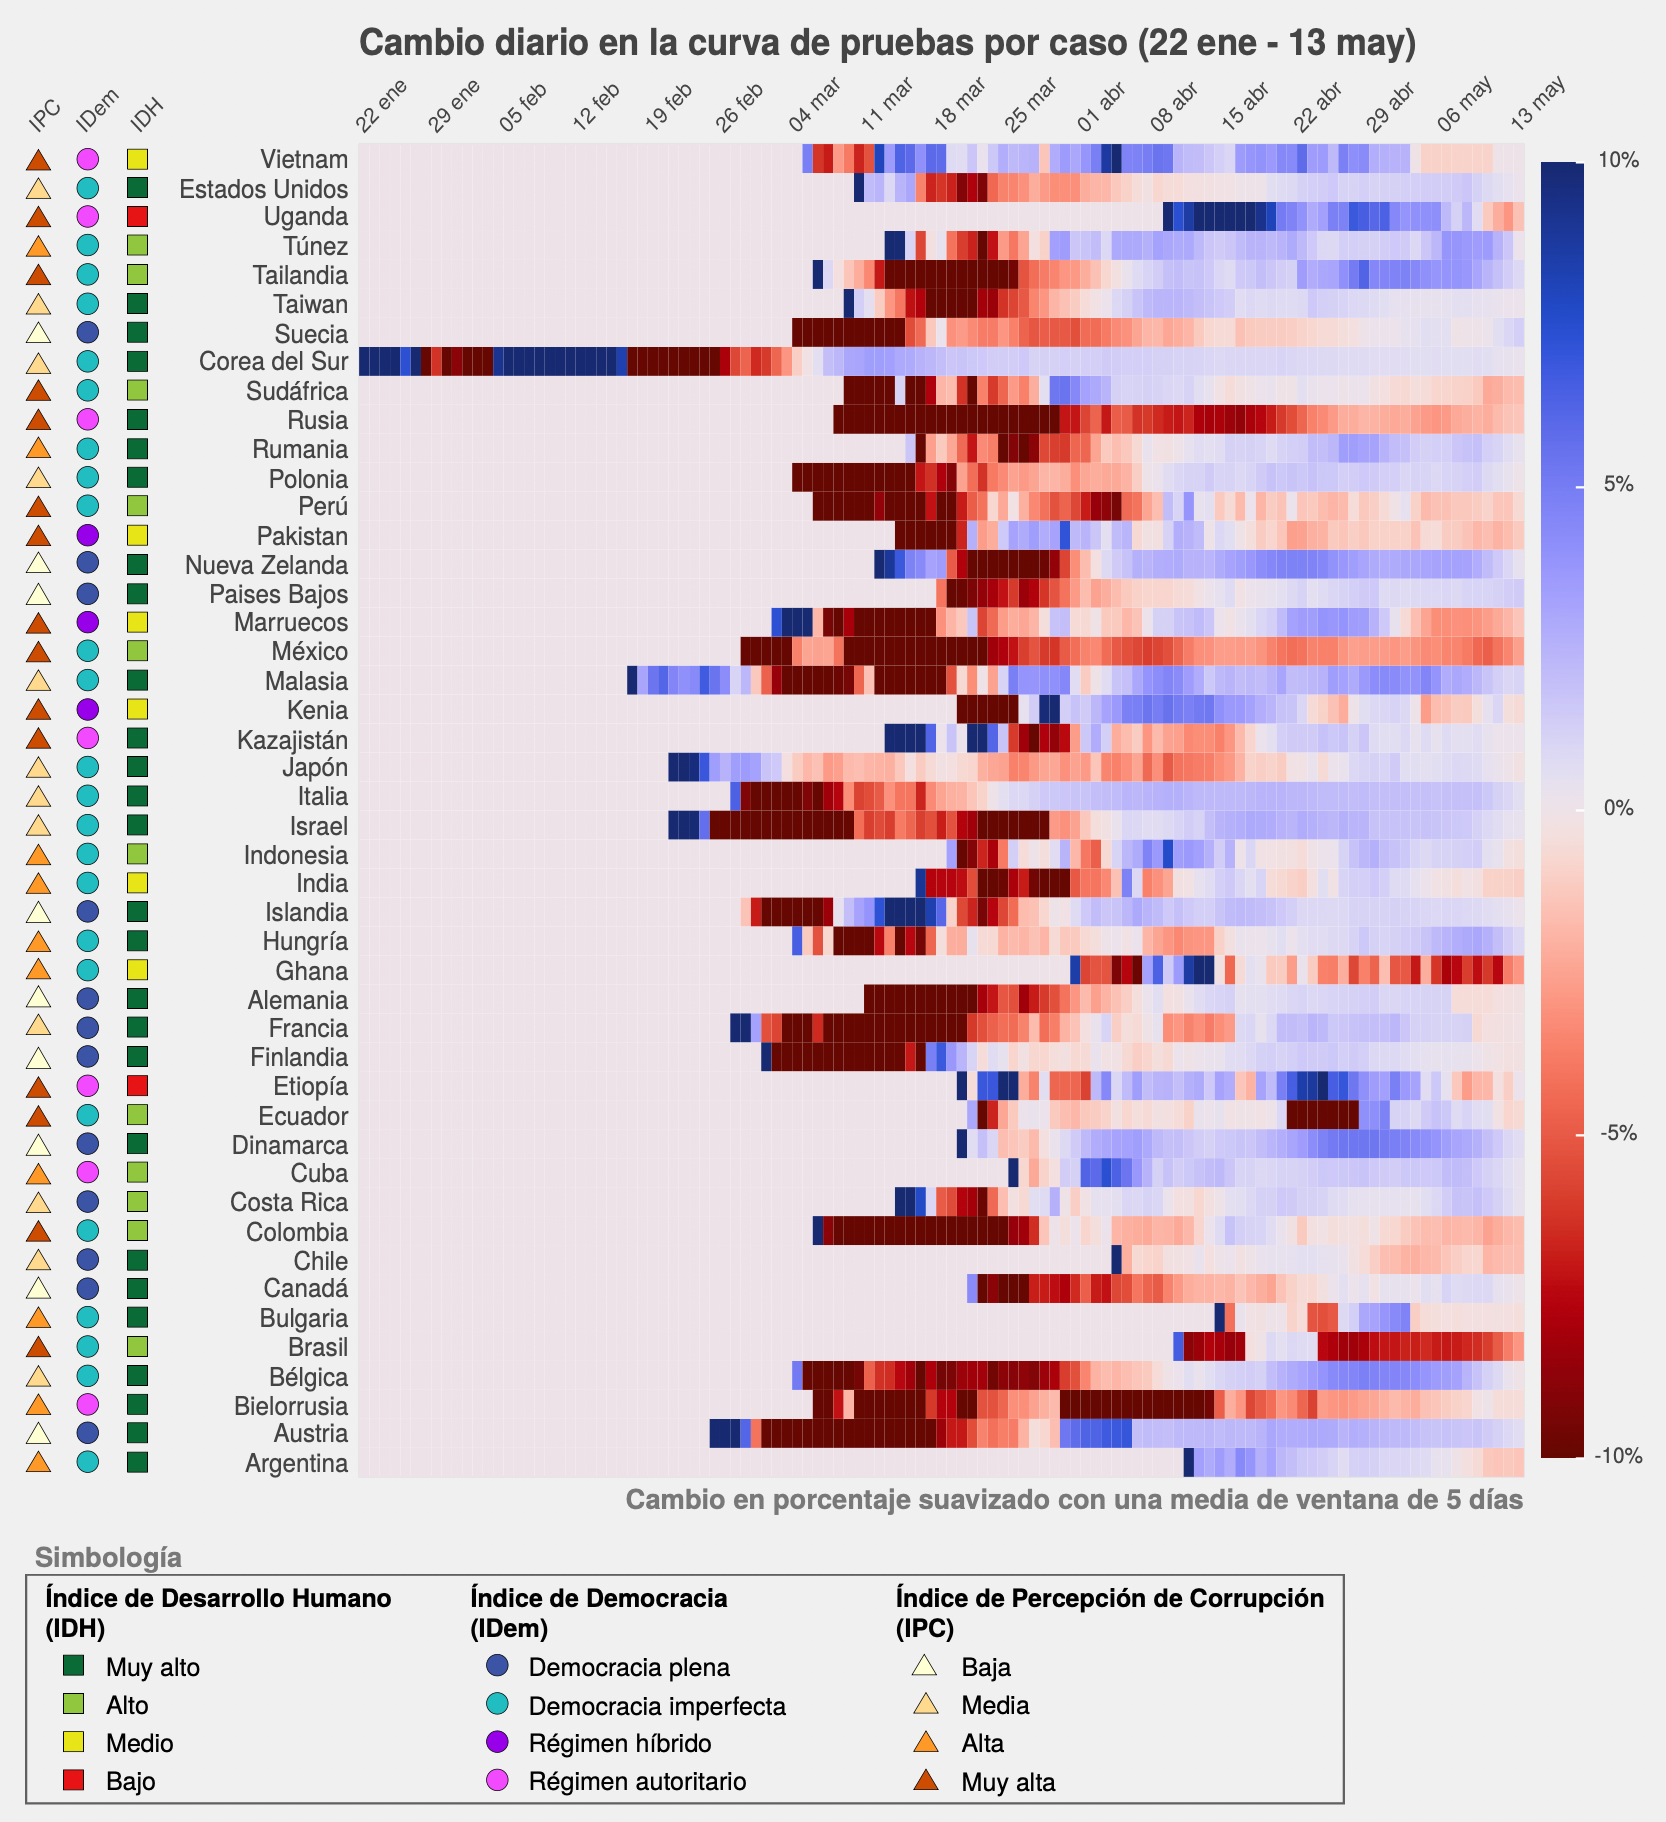
(In Spanish) Comparison between countries and territories with accessible public data regarding number of tests applied per day along with number of positive cases per day.